QGIS3 Tutorial: Markers & Attribute Tables
- Andrew Chu

- Jul 30, 2019
- 2 min read

In forest management, it is important to get accurate data about the trees in the forest. In this instance, LiDAR is used to collect the tree data. LiDAR is a geographic surveying method that can accurately get data about the terrain by using lasers. Using LiDAR we can get data of the trees such as height, crown length ratio, and DBH. The data can be represented in QGIS through markers, and the markers are able to keep a tree’s specific data. In this tutorial, markers will be added to a map that contains contours and borders (border and contour tutorial can be found here). In Nishiawakura Village, Hyakumori has gathered around 3 million individual tree point data via aerial LiDAR research (if you are researching/studying forestry and would like to use the data, please contact via hyakumori.com). This data includes Height, Volume, Crown Length Ratio, & DBH. To add markers, follow these steps:
1. Load in the .SHP files for the markers.
a. Right click the markers layer and go to properties
b. Go to Symbology tab
i. Change category to graduated
ii. Select desired field in column
iii. Choose color
i(a). Change continuous to discrete


Once the markers are placed you are also able find the number of points in a given polygon area. This makes it easier to see how many trees are in one certain area, which allows us to better plan for forest operations. To find the number of markers in a certain polygon follow these steps:
1. Select the border layer
2. Select the “Select Features by Area or Single Click” button
a. Select the desired polygon
3. Right click on the border layer
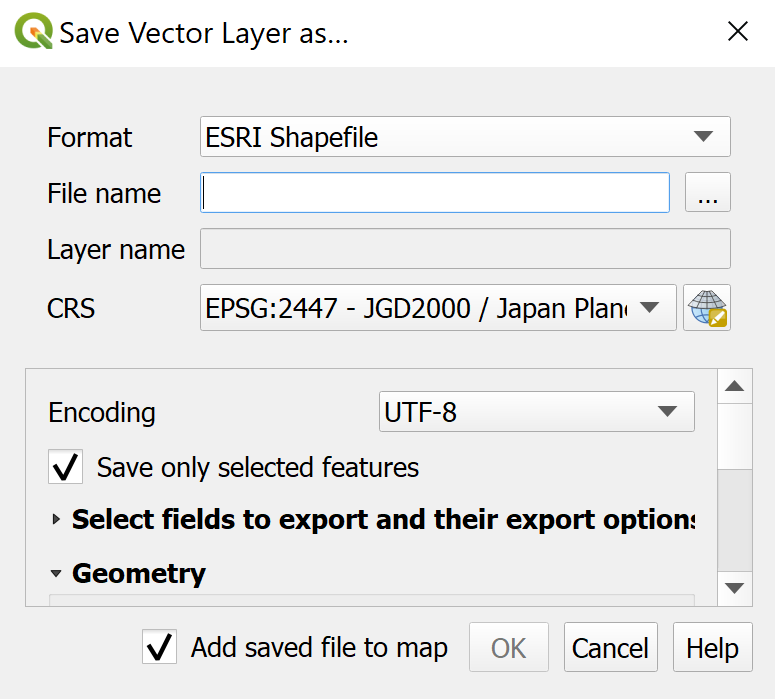
a. Export
i. save the selected feature into new layer
4. Go to processing toolbox and search count
a. Use “Count Points in Polygon”
b. Select count layer and markers


You are also able to change the attribute table to ensure you only show the columns you want. This helps when creating the map layout. To change and show the attributes table
follow these steps:
1. Click on new created count layer
a. Right click and open attributes table
b. Click on “Toggle Editing Mode” button
c. Click on delete column button
i. Delete unwanted columns


You are also able to show the attributes table on your print layout. This is useful in showing what the markers on the map represent. To show the attributes table in your map, follow these steps:
1. Click on "Add Item"
a. Click on "Add Attribute Table"

Markers are useful in forest management as they can represent the trees and its specific details. With markers you are also able to categorize and display specific details about the trees in the area such as volume and amount.


Comments