QGIS3: How to Make a Thinning Map
- Andrew Chu

- Jul 18, 2019
- 4 min read

QGIS3 is a program that allows you to build detailed maps that can help you with forest management and planning. This guide shows you how to create a basic map that can be used a thinning plan for a certain area of forest. To be able to create a map like this you will need certain data files such as a .SHP file that contains land ownership data, a .DEM file for elevation data, and a .TIF file if you want a picture of the area.
To start, open up QGIS3 and load in your .TIF and .SHP file that contains all the land ownership data. Once it has loaded, you should see multiple polygons that represent land ownership. In order to change these polygons into borders follow these steps:
Creating Borders:
1. Right click on the .SHP file that contains the land ownership data
2. Select properties

3. Click on the simple fill tab > Symbol Layer Type > Outline: Simple Line
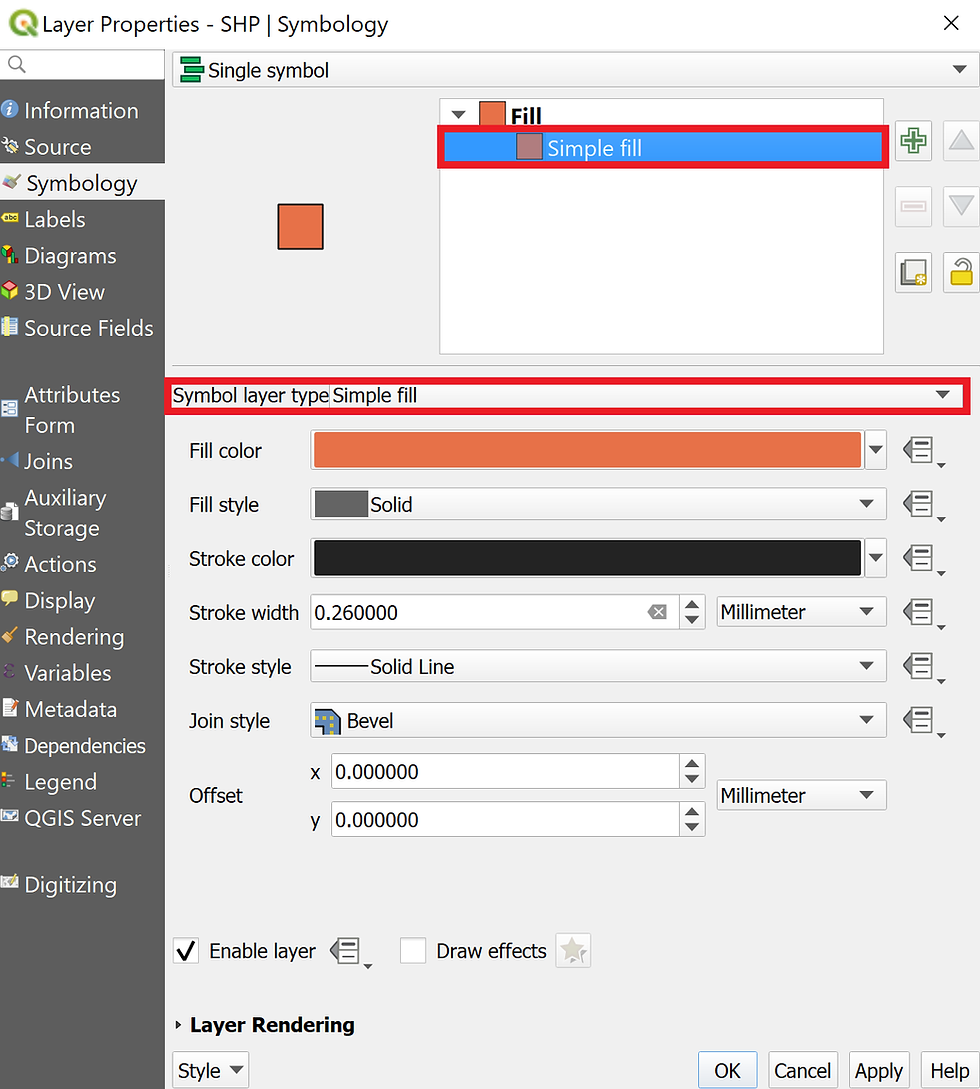
4. Change color if desired
5. Click OK
Once completed, you should have borders representing land ownership on top of your .TIF file.
Now we can load in the .DEM files to give us the contours that show us the varying elevations of the area. This will allow us to better plan the roads for us to build, as we can ensure that the roads will not be too steep or going through a valley. To get these contours, follow these steps:
DEM > Contour:
1. Load the .DEM file into QGIS 3
2. Merge the .DEM files into one
a. Processing > Toolbox > Search “merge”
i. GDAL > Raster Miscellaneous > Merge .DEM layers
3. Search “contour” in the processing toolbox
a. GDAL > Raster extraction > Contour
i. Input Layer should be your merged .DEM


This will create a new layer showing the contours of the area. You can then deselect the merged .DEM file.
Once you have the contours on your map, you can begin to add lines which will represent the roads you wish to create. When drawing these lines, try to pass as few contours lines as possible, as the more contour lines you cross the steeper the roads will be. To create these lines, follow these steps:
Create Lines:
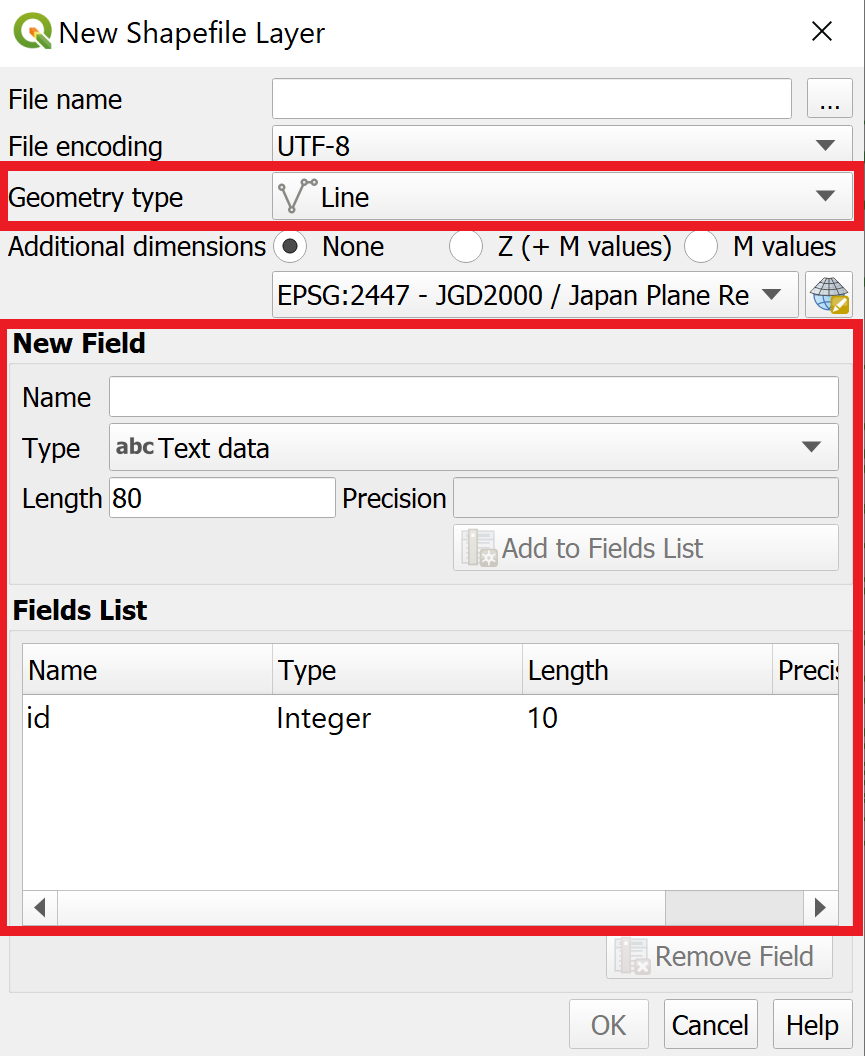
1. Create a new Shapefile layer
a. Layer > Create Layer > New Shapefile Layer > File Name > Save to Desired File
b. Geometry type > Line
c. New Field > “Name” > Add to Field List
2. Toggle editing > Add Line Feature
a. Cross-hair appears, allows you to draw lines from point to point
b. Right click to finish the line
c. Click toggle editing to save the line
d. Click vertex tool if you need to edit the points
3. Item properties allow you to change the color, thickness, and type of line


Now you can add the buffer area to these lines which will show the thinning area that are feasible with the roads planned so far. To add the buffer area, follow these steps:
Add Buffer:
1. Vector > Geoprocessing tool > buffer
a. Select input layer with line you wish to add a buffer to
b. Choose the distance of the buffer
c. Go to item properties and change the color/type


The buffer area shows you the area of land you can retrieve the trees from based on your road layout. You may notice that the buffers may be different polygons. In order to combine into one large them follow these steps:
Merge Vectors (Lines & Polygons):
1. Load in the Shapefiles for the land ownership borders/polygons
2. Vectors > Geoprocessing tools > dissolve
a. Select the layer that has the polygons
b. You can merge polygons based on the polygon’s elements
i. Dissolved field(s) [optional]


The buffer area created may exceed the border, but you are able to get rid of these excess areas. Using the clip function, you can cut the polygon into your desired shape.
To clip away the excess buffer area, follow these steps:
Clipping:
1. Allows you to clip polygons based on the border or another polygon
2. Vector > Geoprocessing Tool > clip
a. Select the layer with the border as input layer
b. Select the layer you wish to clip as output layer
c. Run
d. Select the undesired polygons and delete them using “Toggle Editing”


Now you are ready to export or print your map. In order to export or print your map, follow these steps:
Map Layout:
1. Hover over the area of interest in the main QGIS3 window
2. Click on Project > New Print Layout
3. Add item > Add Map
You can add a second map which can show a wider view of the area and highlight the
location of the area shown on the first map.
4. Add second map
a. Shows a wider view of the area and highlights the area of interest
i. Area of interest
i(1). Item Properties > Overviews >add new overview
i(2). Choose Map 1 for map frame
5. Add shape
a. Change fill and opacity
6. Add north bar
a. Add item > add north bar
7. Add Scale
a. Add item > add Scale bar
i. Ensure the scale bar is in the correct units
8. Add title
a. Add item > add label
9. Add Legend
a. Add item > add Legend
i. Filter which items you wish to show in legend


Comments